Maps and Data
You will find below tools, databases, interactive maps, and other resources that can help inform your air pollution research or community advocacy.
Explore Tools from Air Alliance Houston
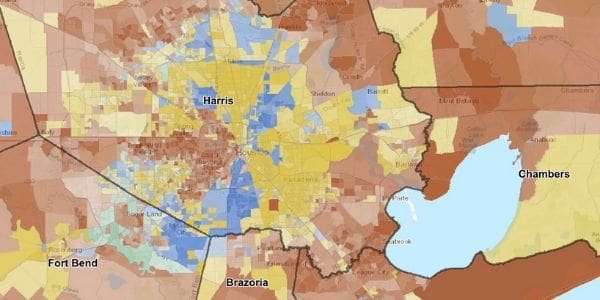
Race and Toxic Facilities
American Community Survey 2017 5-year racial and ethnic demographics in the nine-county Greater Houston area juxtaposed with the locations of EPA Toxic Inventory Sites (TRI).
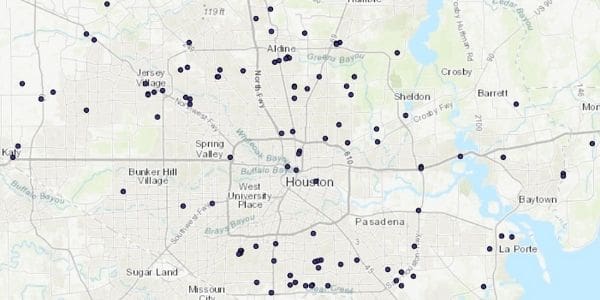
Harris County Concrete Batch Plants and Aggregate Facilities, 2024
Locations of all concrete batch plants, rock crushers, and other aggregate facilities in Harris County received from HC Pollution Control Services as of 2024.
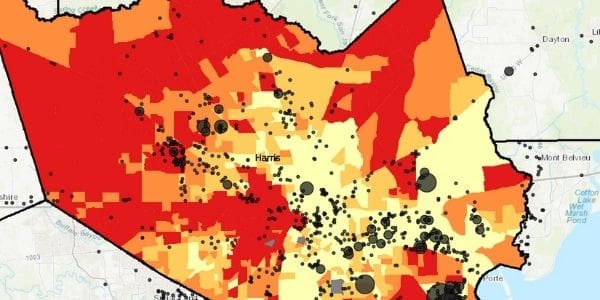
Housing Costs and Toxic Emissions
Median Monthly Housing Costs and Toxic Emissions.
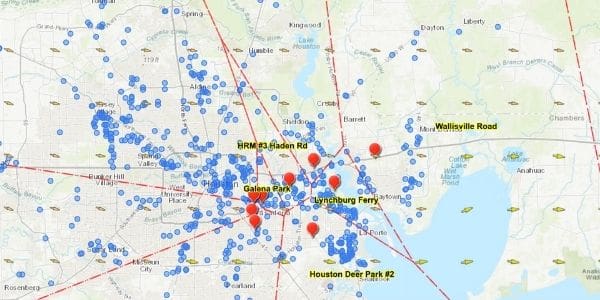
Nearest AutoGC Monitor
TCEQ AutoGC (VOC) monitoring locations (red needles) with TRI facility locations (blue dots) and prevailing wind conditions (arrows). The polygons encapsulate the nearest monitor for a given location within the State of Texas.
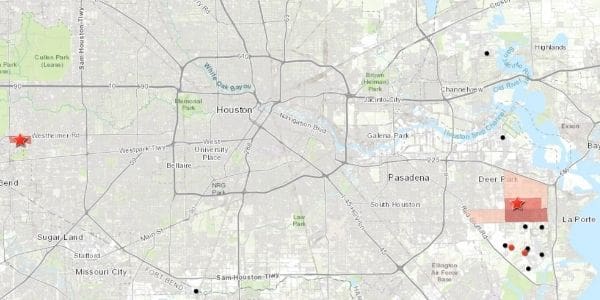
Ethylene Oxide Risk Map
US Census Tracts with greater than 100 in a million excess cancer risks from ethylene oxide exposure. Top 25 industrial sources for ethylene oxide emissions in the United States from 2008-2018. Other industrial sources of ethylene oxide emissions.
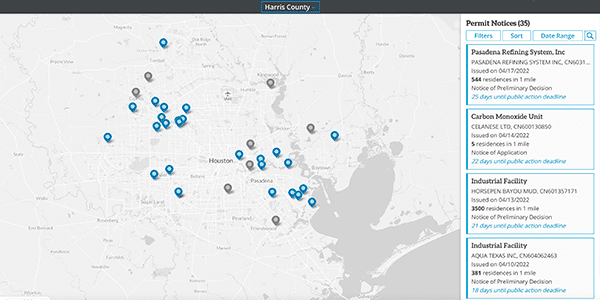
Open TCEQ Air Quality Permits
This map shows the locations for TCEQ Air Quality permits that have been applied for in Texas. Check your area for opportunities to participate in the permitting process.

Ozone and Health Impacts in Gulfton
This is a StoryMap explaining Ozone and its health impacts focusing on the Gulfton area in Houston.
Explore Tools from Other Organizations
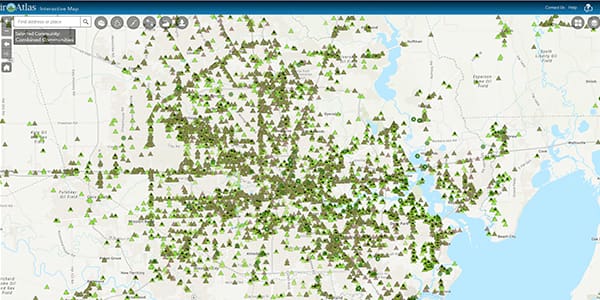
EnviroAtlas
Developed by the US EPA and partners, EnviroAtlas provides hundreds of interactive tools and resources for exploring the interaction between people, the built environment, and ecosystems. Users can access maps, analysis tools, downloadable data and informational resources to better understand the true value of ecosystems and how various decisions can affect ecological, health and equity outcomes.
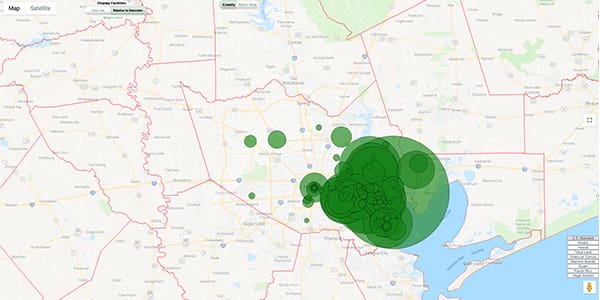
Facility Level Information on GreenHouse gasses Tool (FLIGHT)
The US EPA’s Facility Level Information on GreenHouse gases Tool (FLIGHT) allows you to locate large emitters in your community or state and view the amounts of greenhouse gases (GHG) emitted. You can filter GHG data in a variety of ways, including by facility, industry, location, or gas. FLIGHT can also generate customized downloadable graphics (pie charts, trend lines, etc.) and facility lists.
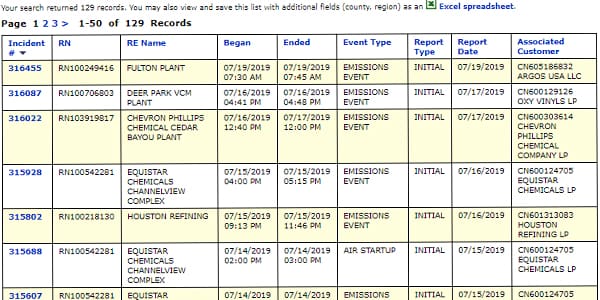
Air Emissions Event Report Database
The TCEQ’s Air Emission Event Report database allows you to search for and learn about events in Texas that have resulted in unauthorized emissions releases. Examples of such events include process upsets, unscheduled maintenance, and process shutdowns and restarts that result in unauthorized air emissions.
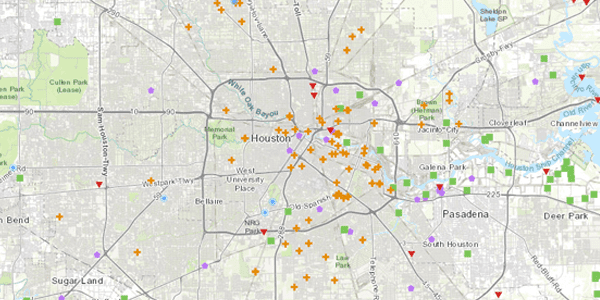
Cleanups in My Community (CIMC)
Cleanups in My Community is intended to provide information about sites that might need to be cleaned up, are being cleaned up, or have been cleaned up, in your community or anywhere in the United States. The information can help people understand what is happening in their community, what has happened, and, with the contextual information provided, what could happen if certain events take place. The CIMC tool is available here, and more information about the cleanup programs CIMC tracks can be found here.
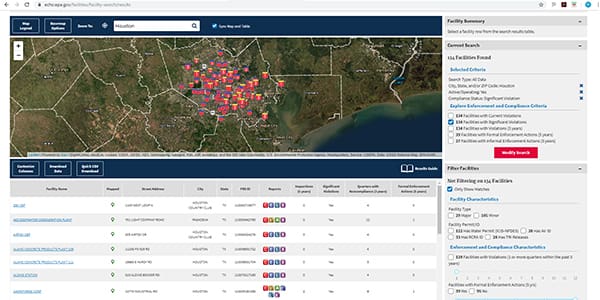
Enforcement and Compliance History Online (ECHO)
The US EPA’s Enforcement and Compliance History Online (ECHO) website lets you search for facilities in your community to assess their compliance with environmental regulations. For any given facility, you can find information on permits, inspections, violations, enforcement cases, and penalties. The tool also provides many features to visually explore the data.
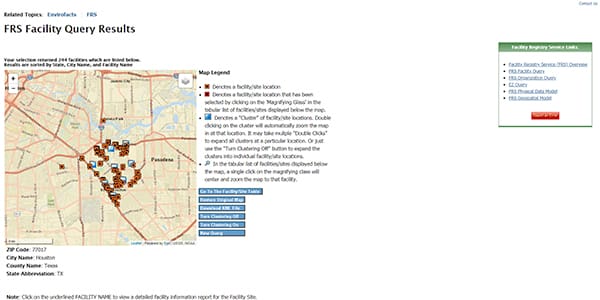
Flight Registry Services Query (FRS Query)
The US EPA’s Facility Registry Services (FRS) Query allows you to retrieve comprehensive data about facilities, sites, or places of environmental interest that are subject to regulation. You can search by any combination of facility name, geographic location, nearness to lands inhabited by indigenous tribes, industrial classification, affiliated organization and contact, and national systems.
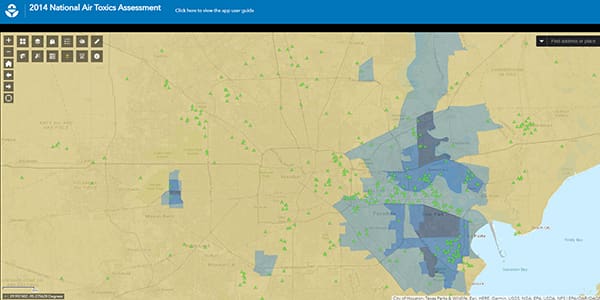
National Air Toxics Assessment (NATA)
The National Air Toxics Assessment (NATA) by the US EPA is a screening tool that helps users estimate and understand the health risks (cancer and other serious health effects) from long-term exposure to air toxics. The tool helps in finding out which air toxics, emissions sources, and places may need further study to better understand risks.
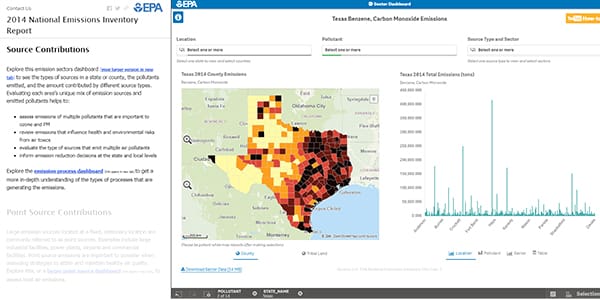
National Emissions Inventory (NEI)
The US EPA’s National Emissions Inventory (NEI) is a comprehensive summary of US air emissions data compiled every three years by the EPA with the help of many organizations. The NEI Report is a highly visual and interactive tool that summarizes national and state emission trends and emission profiles for states and counties.
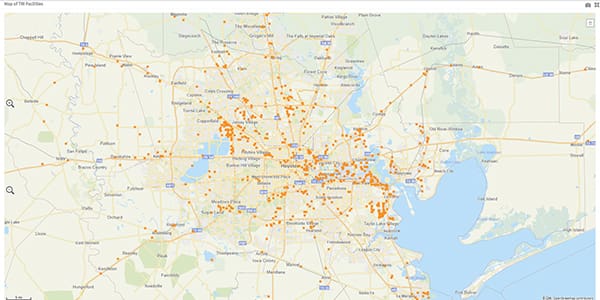
Risk Screening Environmental Indicators
The US EPA’s Risk-Screening Environmental Indicators (RSEI) model lets you explore data on releases of toxic substances from industrial facilities. The application uses information from EPA’s Toxic Releases Inventory (TRI) and gives each facility a score. This score corresponds to the risk each facility poses toward the quality of human life. RSEI Scores can be used by policy makers, researchers and communities to help establish priorities for further investigation.
RSEI is a standalone computer application. A smaller version, called EasyRSEI, can be accessed via web-browser.
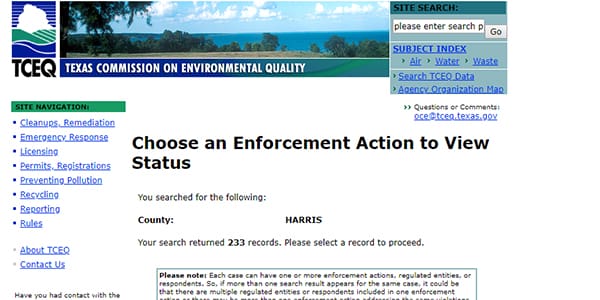
TCEQ: Track Complaints and Enforcement
The TCEQ offers tracking tools that let you search information about environmental complaints and pending enforcement actions in Texas and check on their status. You can filter your search by different criteria to find details about a specific case.
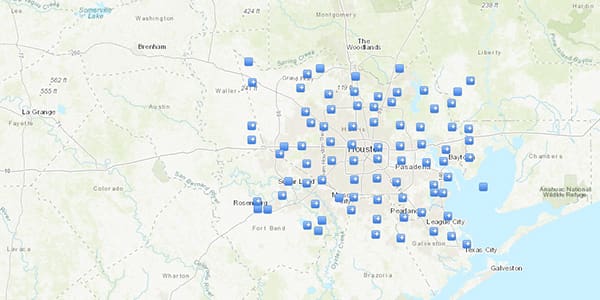
Toxic Release Inventory (TRI)
The Toxic Release Inventory (TRI) is a publicly available US EPA database that tracks the management of over 650 toxic chemicals that may pose a threat to human health and the environment. More than 20,000 US industrial facilities annually report to the EPA the quantities of TRI chemicals released to the environment or managed through recycling, energy recovery, and treatment.
Use TRI Search to retrieve data from the TRI database.
Use TRI Explorer to generate reports on releases, transfers, and waste managed. You may also generate location-based factsheets relevant to your community.
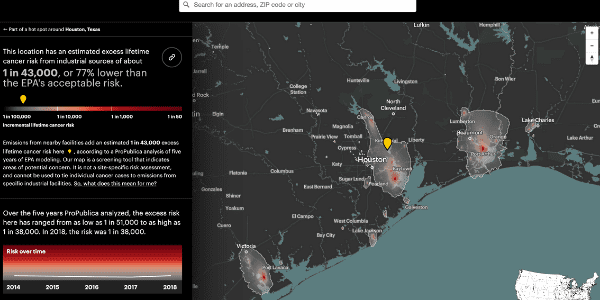
Cancer-Causing Industrial Air Pollution in the U.S.
Investigative journalists at ProPublica analyzed U.S. EPA emissions data to create “the most detailed map of cancer-causing industrial air pollution ever published.”
Spill Tracker
The Spill Tracker platform by Beyond Petrochemicals shines a light on the danger of petrochemicals. This tool tracks fires, flares, spills, and other petrochemical incidents, which occur on average every four days across the country. Updates are published on the site weekly, demonstrating the danger these toxic chemicals pose.

FencelineData.org
FencelineData.org provides facility-level information about environmental violations and toxic-chemical and greenhouse-gas pollution at 21,000 facilities that report to the U.S. Environmental Protection Agency.

Spotlighting the Environmental Impact of Oil, Gas, and Petrochemical Expansion
This database from Oil and Gas watch allows you to search oil and gas industry facilities and pipelines throughout the U.S.
