

Anthony D'Souza & Dawson Phillips
Community Air Monitoring Programs Manager // Research and Policy Coordinator
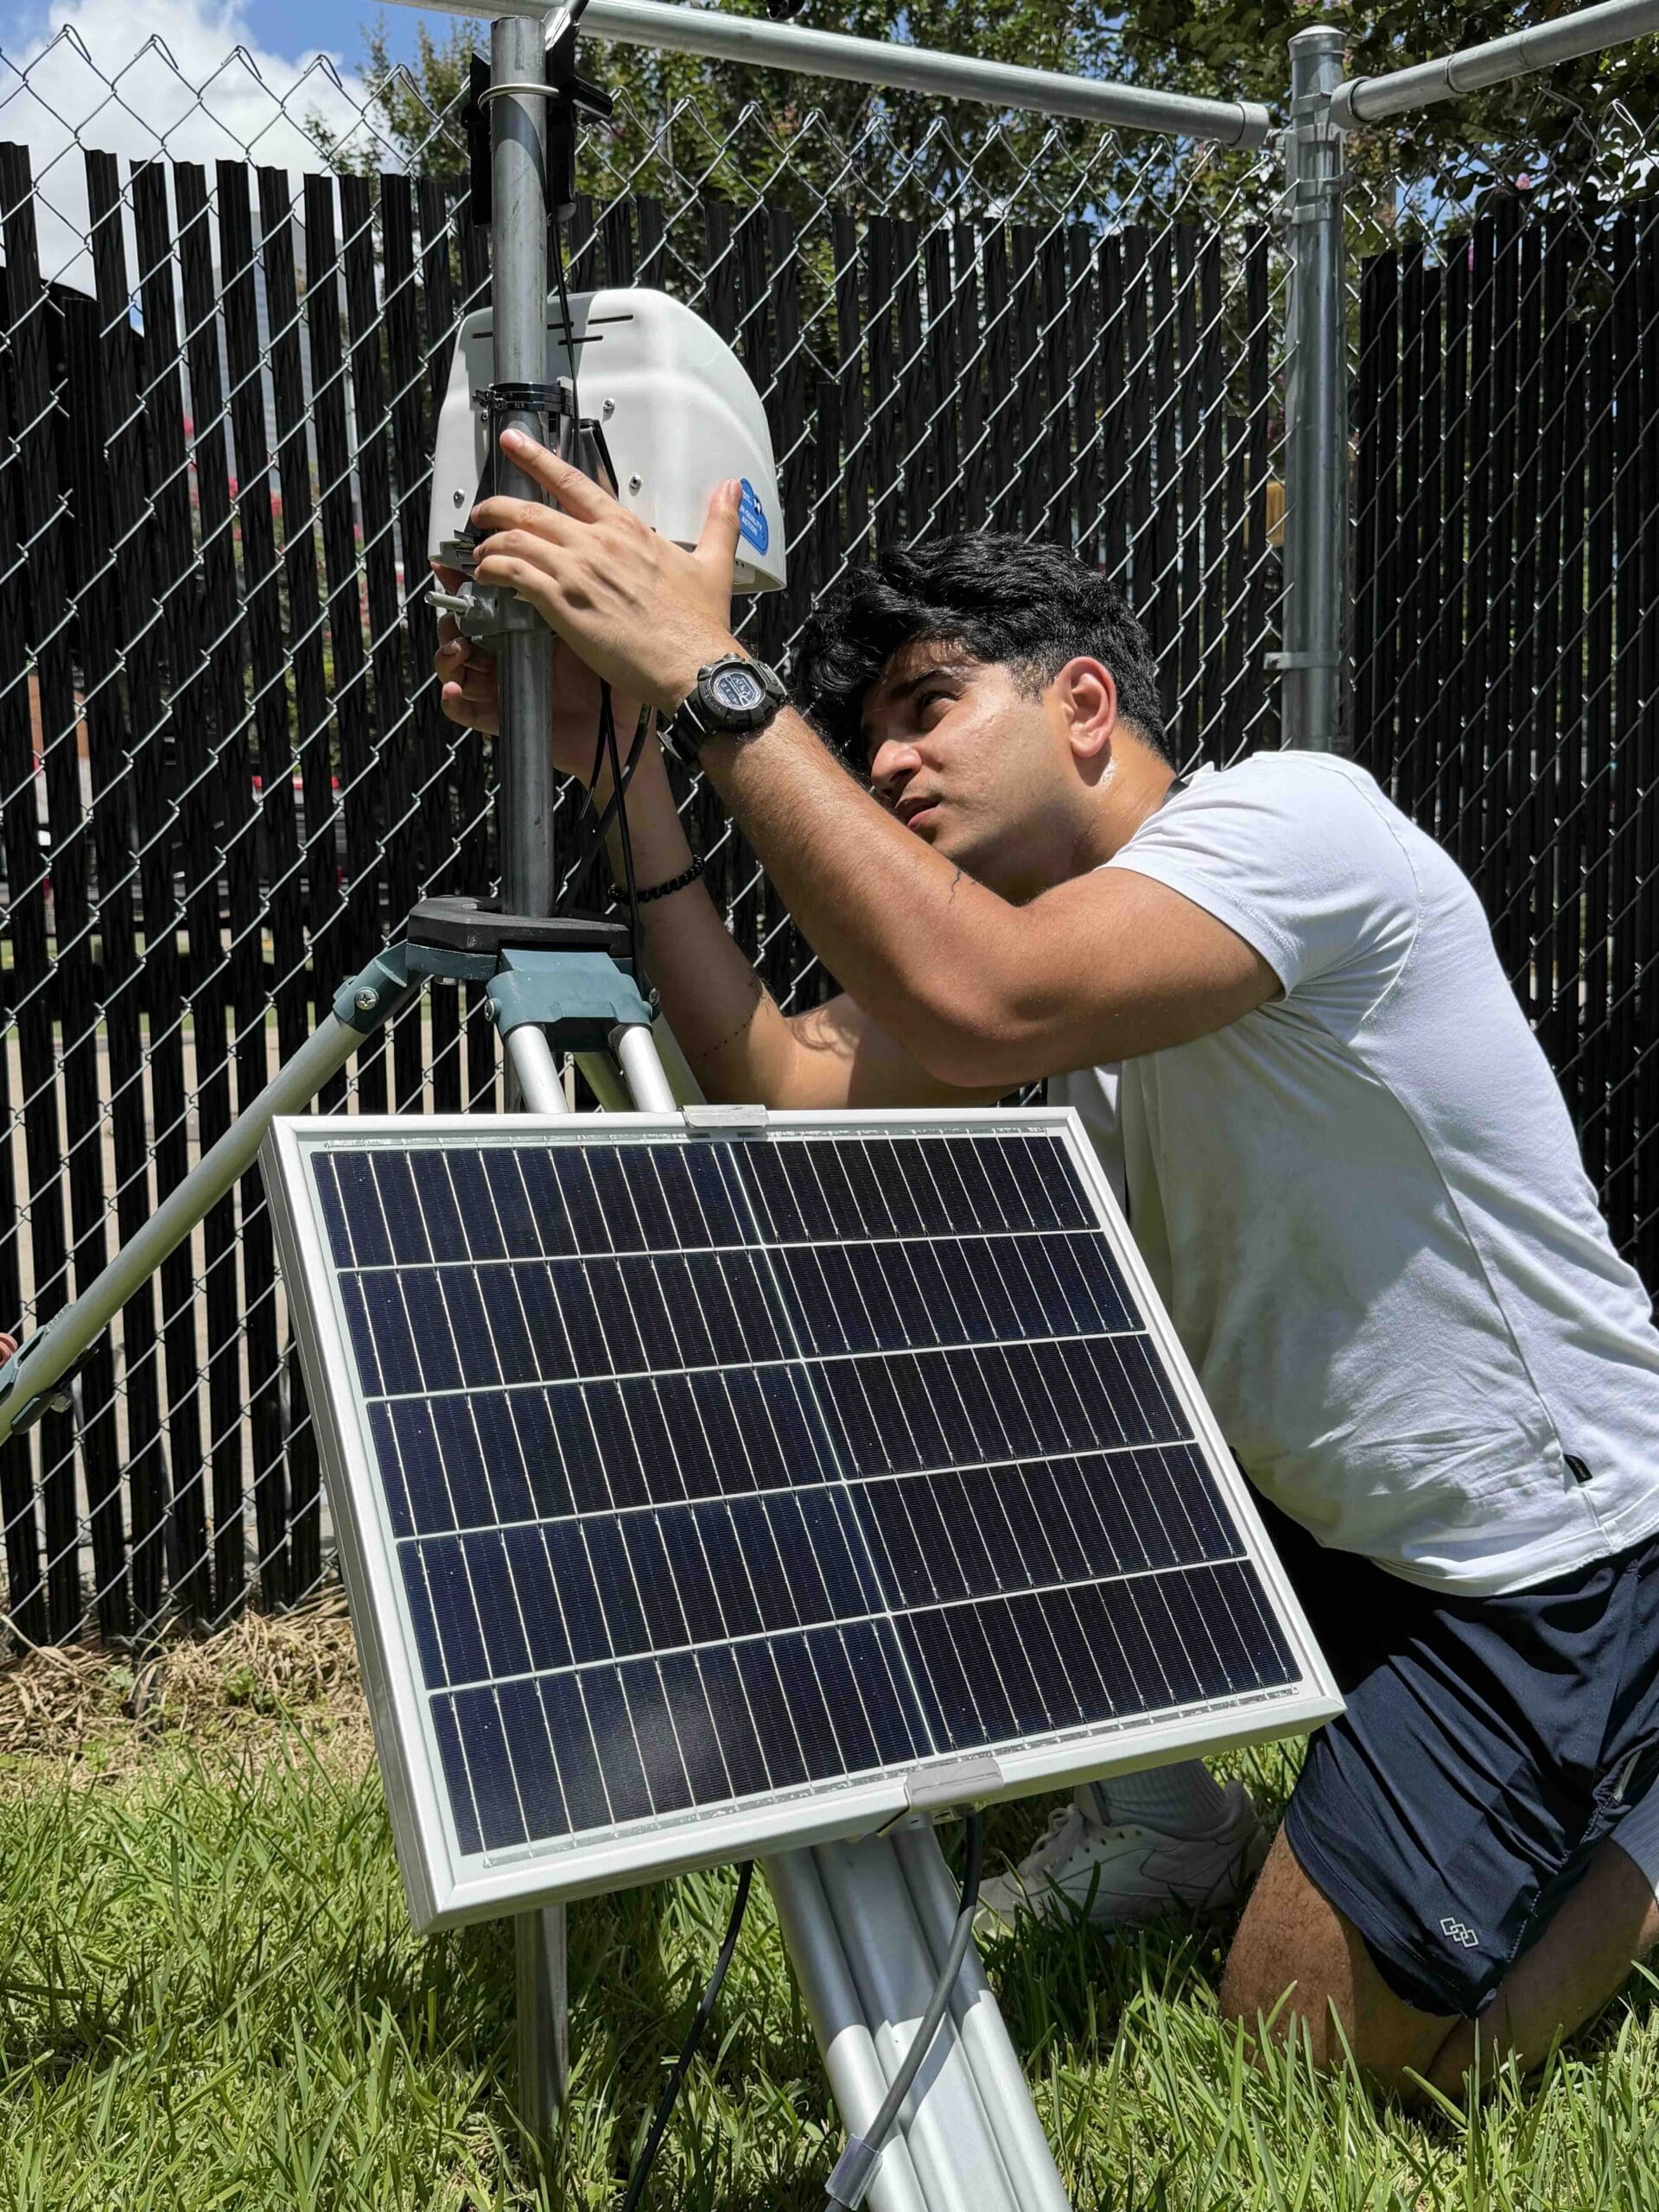
In April 2023, the Community Air Monitoring Program (C.A.M.P.) at Air Alliance Houston celebrated its 1-year anniversary. In reflection on this milestone, we compiled and analyzed an entire year’s worth of air monitoring data collected by approximately 50 low-cost sensors distributed across five different communities: Pasadena, Galena Park/Jacinto City, Kashmere Gardens, Near Northside, and Gulfton. Doing so allowed us to examine regional air quality patterns that affect large swaths of the city while also discerning differences in each community’s air quality to glean insights into their unique sources of pollution.
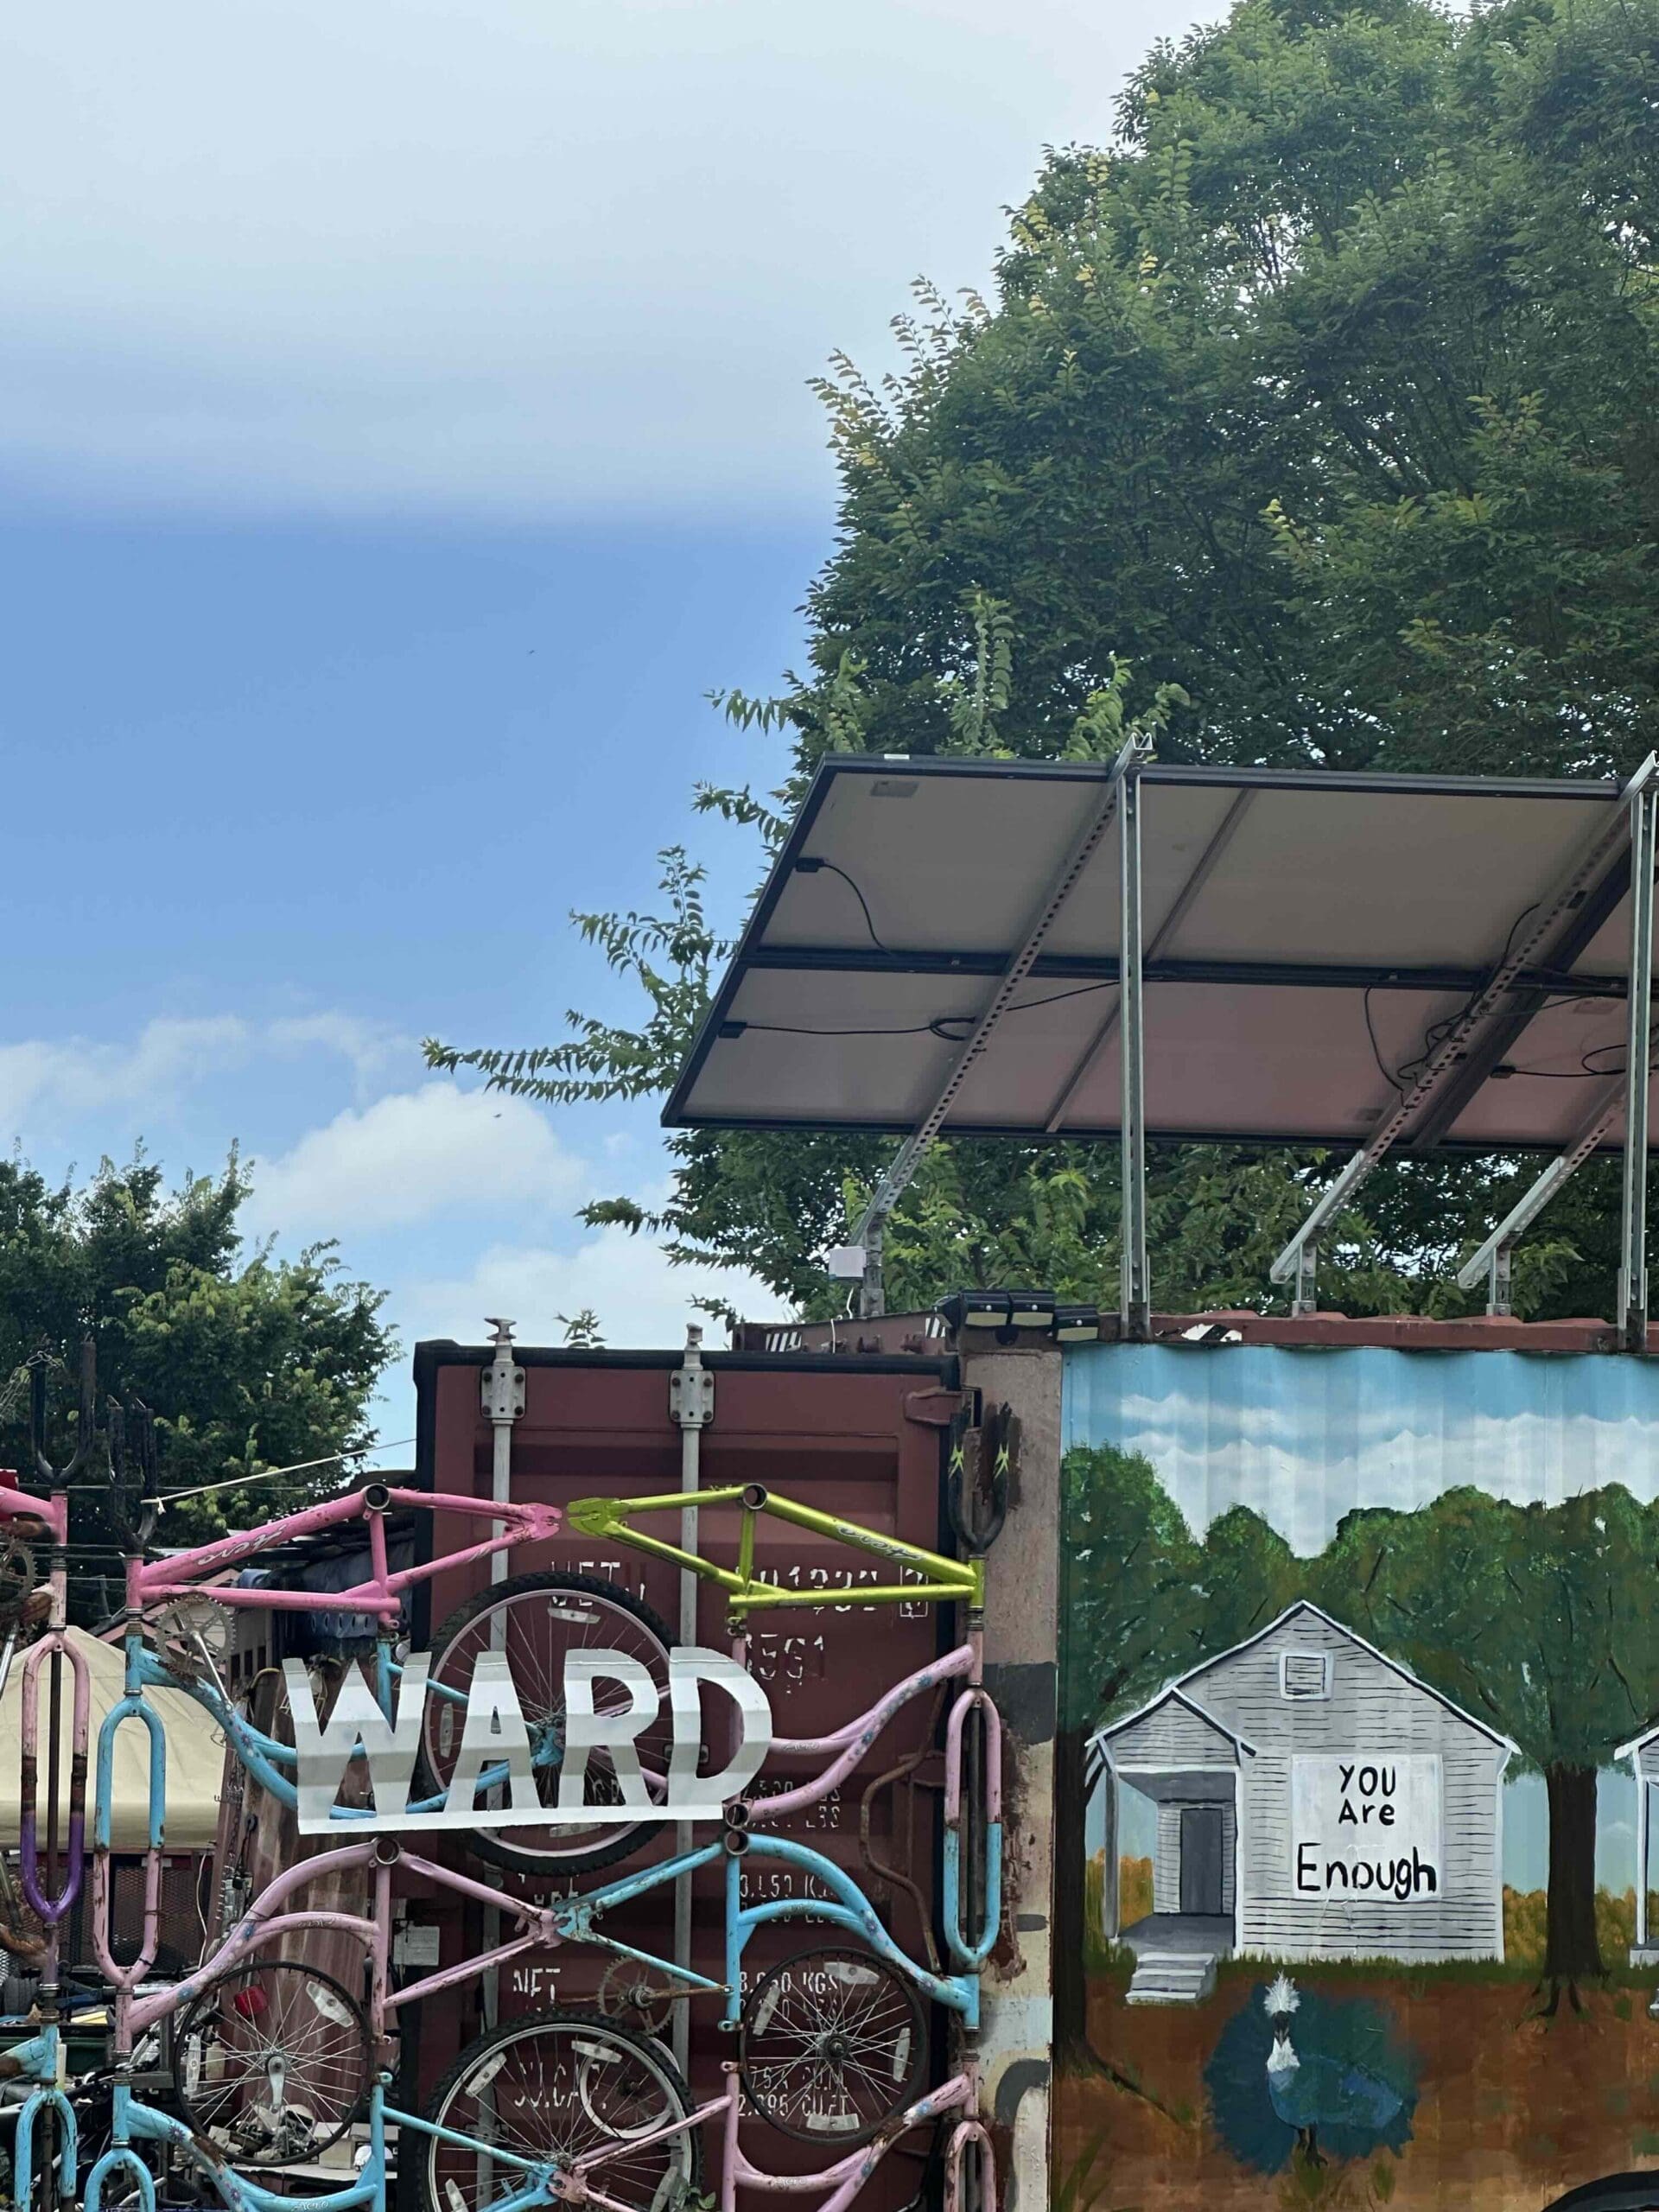
At the end of July 2026, our staff decided it was time to conduct another such review of the air monitoring data collected over the preceding year. This was especially timely considering the expansion we undertook over the last 3 years. Our current network includes over 100 sensors now distributed across 10 communities, having since broadened our program to serve residents of Baytown, Channelview, Deer Park, East Houston/Settegast, and Cloverleaf as well. Earlier this year, we also built out a network in the Third Ward/East Downtown area. In the coming months, we seek to continue our efforts with targeted expansions in East Aldine, La Porte, Texas City, Conroe, and the Greater East End area to fill gaps in the current air monitoring landscape.
Our current monitoring capabilities allow us to simultaneously measure four different types of air pollutants: Nitrogen Dioxide (NO2), Volatile Organic Compounds (VOCs), Ozone (O3), and Particulate Matter (PM).

We observed little variation in NO2 concentrations measured between C.A.M.P. communities, suggesting that sources of NO2 pollution are ubiquitous across these areas and affect all neighborhoods. This is validated when examining prevalent sources of NO2: vehicular exhaust, power plants, industrial facilities, and anywhere where fossil fuels are burned at high temperatures. These sources are inescapable across the city, particularly in the aforementioned C.A.M.P. neighborhoods with truck yards, massive freeways, petrochemical plants, and the Houston Ship Channel burdening them all with NO2 every day. Furthermore, given that NO2 breaks down rapidly in the atmosphere – only remaining in the air for a few hours to a day – the persistence of these levels at an elevated level over the entire year hints towards continued and unabated emissions occurring over long timescales in C.A.M.P. neighborhoods. Lastly, despite average NO2 levels across all C.A.M.P. communities remaining below the EPA’s annual standard of 53 parts per billion (ppb), these same levels were still well above the WHO’s annual standard of 5.3 ppb.
When analyzing average VOC levels over the past year, we observed a noticeable increase in May and June of 2026, particularly in communities surrounding the Ship Channel. Delving into the data on a more granular level revealed concentrations of VOCs peaking almost daily during early morning hours. This pattern is most likely attributable to increased industrial start-up activities occurring during these months, especially if we factor in reduced traffic emissions due to school closures during the summer. Furthermore, VOCs include highly reactive and toxic chemicals such as benzene and ethylene oxide that are especially released in large quantities by petrochemical plants and other industrial sources. This observation is further validated by the disparity in average VOC levels between C.A.M.P. communities: Jacinto City, Pasadena, Cloverleaf, and other areas surrounding the Ship Channel and its petrochemical presence measured higher levels than neighborhoods farther away from the Port.
Ground-level ozone is formed when the previous two pollutants–NO2 and VOCs–combine with heat and sunlight, particularly during days when winds are stagnant, thus creating smog. Ozone levels thus generally reach their highest levels in summer months, and our air monitoring data revealed this pattern manifested over the past year as well. When comparing 2025 to 2026, last year witnessed significantly higher levels of ozone, with the highest 8-hour average concentration reaching 95 ppb in 2025 compared to 67 ppb in 2026. For reference, the EPA’s standard for ozone measured over an 8-hour period is 70 ppb. This difference is most likely due to more rainfall being recorded this year compared to last year. Rainy weather brings increased cloud cover and, with it, a reduction in sunlight reaching the ground, which thus inhibits ground-level ozone formation. Overall, Near Northside and Northline experienced the highest annual average levels of ozone across all C.A.M.P. communities, although continuous data were unavailable for certain months due to monitor maintenance being undertaken. Elevated ozone levels in these communities could be attributed to the heat island effect, congregated emissions from several major freeways bisecting these communities, and also acutely local sources of VOCs such as metal recyclers, asphalt plants, and truck yards. Once again, while concentrations of ozone did not significantly surpass the EPA 8-hour standard, they well exceeded the WHO’s standard across all C.A.M.P. communities.
Perhaps the most concerning finding in our analysis pertained to levels of PM, with average PM2.5 concentrations across all C.A.M.P. communities remaining above the EPA standard of 9 μg/m3 and well above the WHO’s annual standard of 5 μg/m3 for the entire year. Cloverleaf, Galena Park/Jacinto City, and East Houston/Settegast in particular measured the highest annual average concentration of PM2.5, with neighborhood-specific sources of particulates likely contributing to each of these levels, like concrete batch plants and metal recyclers in East Houston/Settegast and portside emissions and petrochemical plants in Galena Park, Jacinto City, and Cloverleaf. This is of extreme concern since PM2.5, or fine particulate matter, continues to be responsible for the most deaths of any air pollutant across the world. The microscopic size of these particles–30 times smaller than the width of human hair–allows them to bypass our natural respiratory defense against air pollution and penetrate deep into our lungs and bloodstream. Once there, they are transported throughout our body wreaking widespread havoc especially in sensitive organs such as the brain, heart, and lungs.
Despite fine particulate matter concentrations in Houston remaining above the federal standard set in 2024, litigation by the current EPA administration alongside industry groups has stalled the enforcement of the area’s nonattainment status. The US Court of Appeals has since upheld the 2024 standards and has called on the EPA to finalize nonattainment designations by February 7, 2027. We expect the Houston-Galveston-Brazoria area to be considered a nonattainment area for PM2.5, which would strengthen protections against PM2.5 emissions for residents already experiencing unhealthy levels of particulate matter.
A “nonattainment” designation would require more stringent regulation to reduce particulate matter emissions from industries and other major sources. Until then, the Texas Commission on Environmental Quality (TCEQ) regulates Houston area PM2.5 emissions with respect to the now-outdated federal standard of 12 μg/m3, despite the above monitoring data, as well as TCEQ’s own monitors, showing levels of PM2.5 in the area exceeding this standard.
Given these ongoing trends across the Greater Houston area, regulations and enforcement around particulate matter emissions need to be strengthened rather than rolled back. The current standard of 9 μg/m3 is lax enough as is, especially in relation to the WHO’s standard, which was developed by international panels of environmental health experts, epidemiologists, and toxicologists that evaluated hundreds of peer-reviewed global studies connecting PM concentrations to cardiovascular and respiratory morbidities. Further loosening regulations, as proposed by our federal and state government, would only lead to a greater number of such morbidities experienced by residents, especially those in fenceline communities.
More details of the C.A.M.P. air monitoring data for 2025 to 2026 may be downloaded here.
Want more information on our Community Air Monitoring Network or air quality? Read more here: